Solar PV use case
Set out your solar arrays on site, before you price
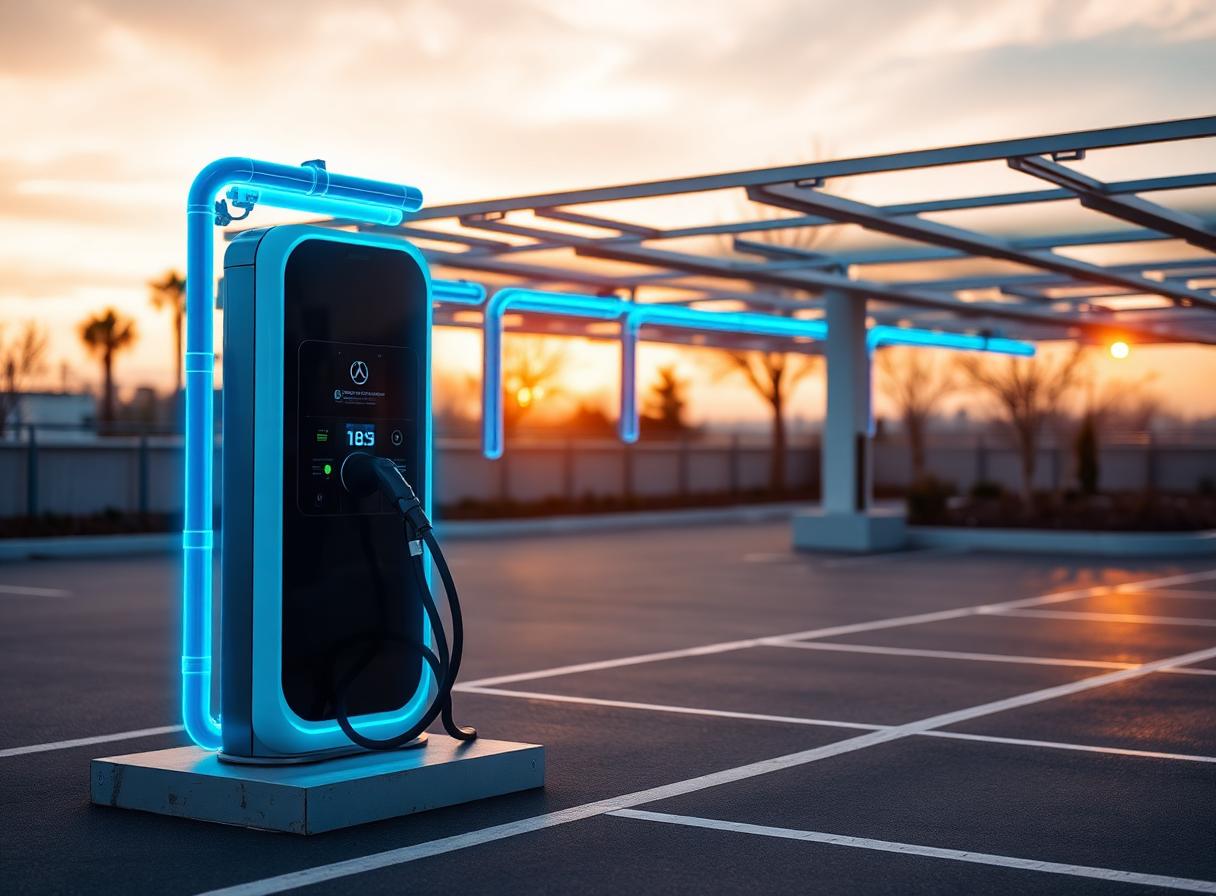
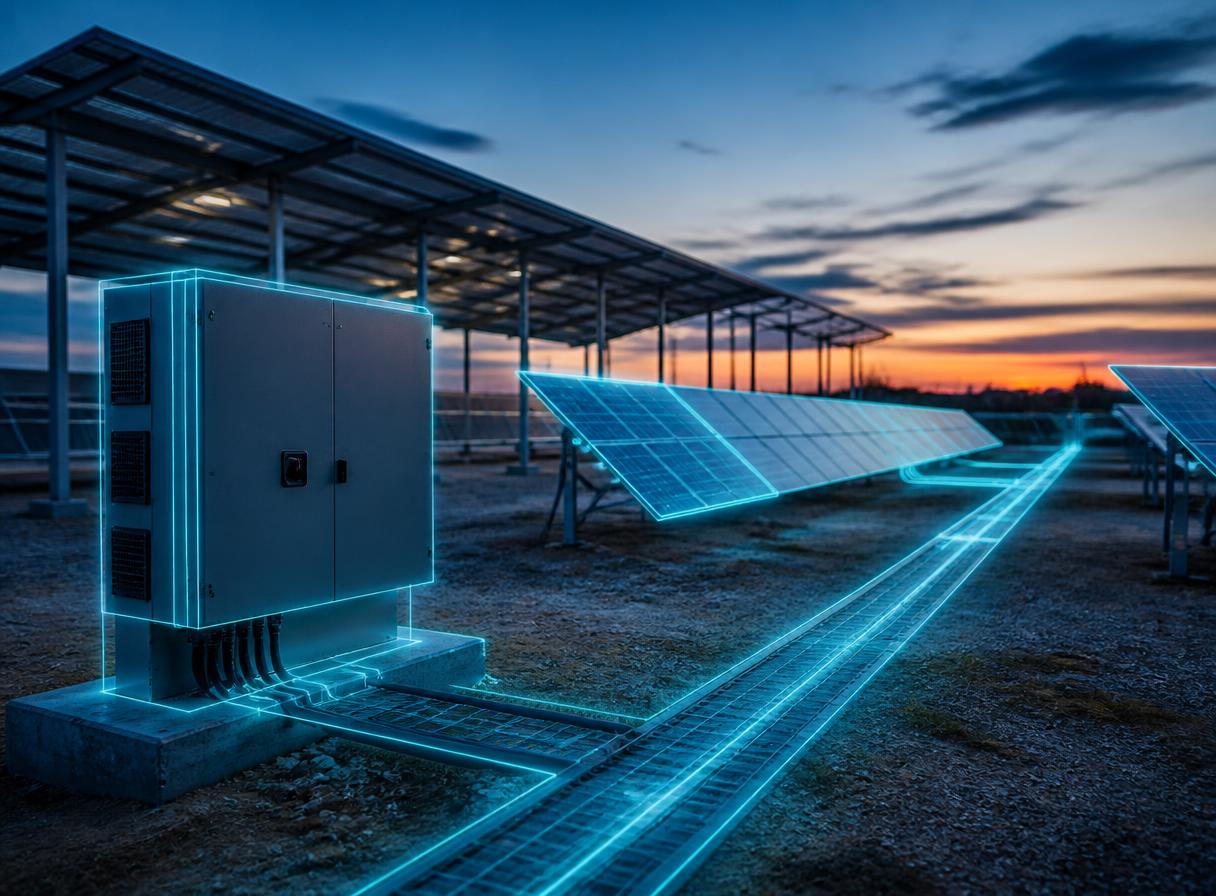
Arrays, canopies, inverters and cable routes appear at real scale on the plot or the car park. You check footprints, heights and access with your client, then leave with the survey report.
On the field
What goes wrong on site
Footprint does not read off a drawing
Row spacing, structure height, shading: on a 2D drawing your client signs off a diagram, not an installation. The gaps turn up during assembly.
Clients will not commit to what they cannot see
A car park operator or a farmer thinks in terms of how the site is used, not in kilowatt-peak. Until they have seen the headroom, the lost bays and the traffic routes, the decision slips.
The survey gets rebuilt at the office
Inverter positions, distance to the point of connection, cable routing, maintenance access: these drive the price, and today they are noted by hand and written up days after the visit.
Linkerman method
How a survey runs
- 1Step 01
Set out the arrays on site
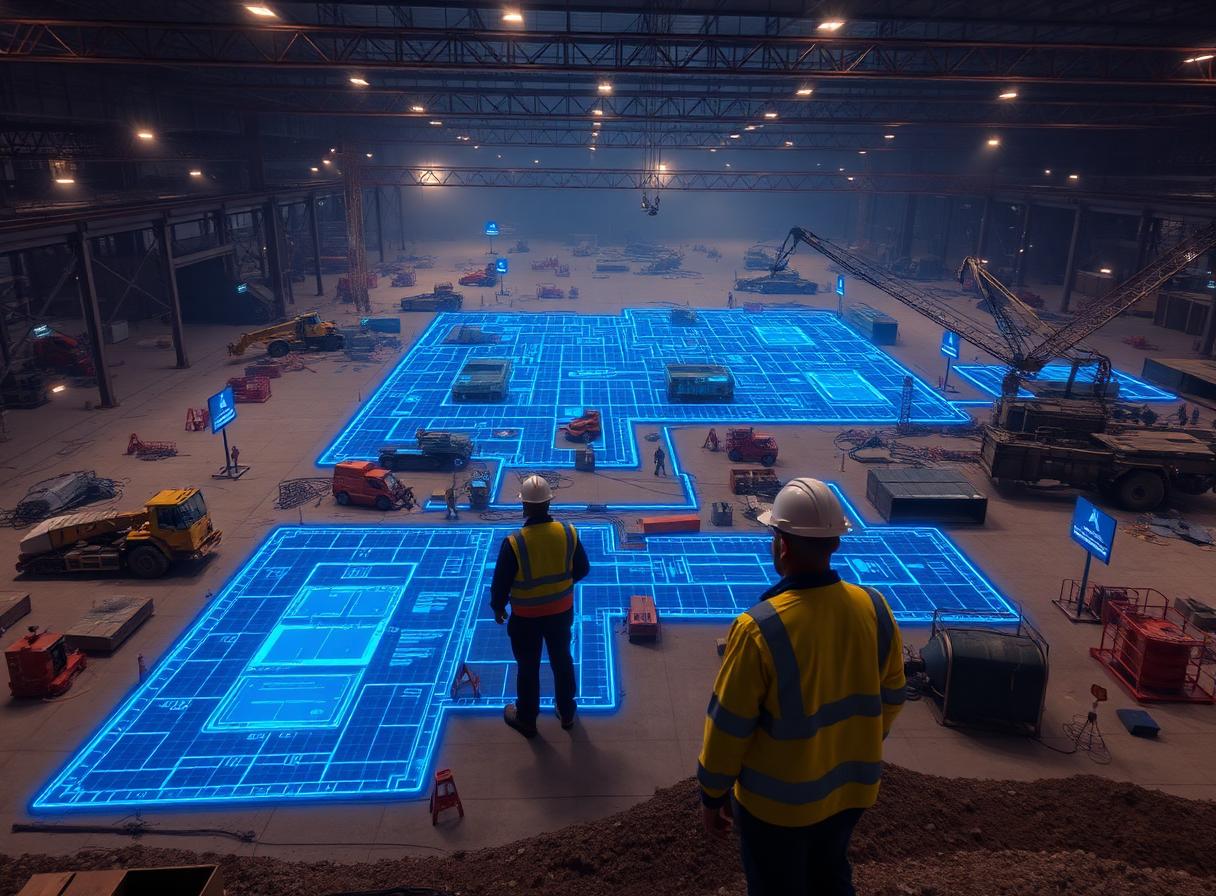
Arrays, canopies, inverters and cabinets appear at real scale. Footprints, row spacing, headroom and maintenance access are checked on the spot, in minutes.
- 2Step 02
Let your client decide on site
The client, your engineering consultancy and your partners follow the session live, on site or remotely, and settle the layout with you.
- 3Step 03
Produce the survey report
Measurements, photos, point markers and the information grid captured during the session feed the report, exported to PDF and PowerPoint.
Frequently asked questions
- Canopies, rooftop or ground-mount?
- All three. The app shows any equipment at real scale where it will sit: ground-mounted arrays, car park canopy structures or rooftop modules, provided the area can be accessed safely.
- Do we need a layout drawing first?
- No. You position everything directly on site during the visit, with no file import and no preparation beforehand.
- Can we cover a solar canopy and its EV chargers in one visit?
- Yes. Canopy structures, chargers, cabinets and cable routes are positioned in the same session, and it all comes out in a single survey report.
- Does the report help with the grid connection application?
- The report records positions, time-stamped measurements, contextual photos and the information grid filled in on site. Those elements feed straight into your application file.
See it run on a solar project.
Someone from the team comes to your offices. You put on the headset, site a piece of equipment yourself and run the survey through to the report.